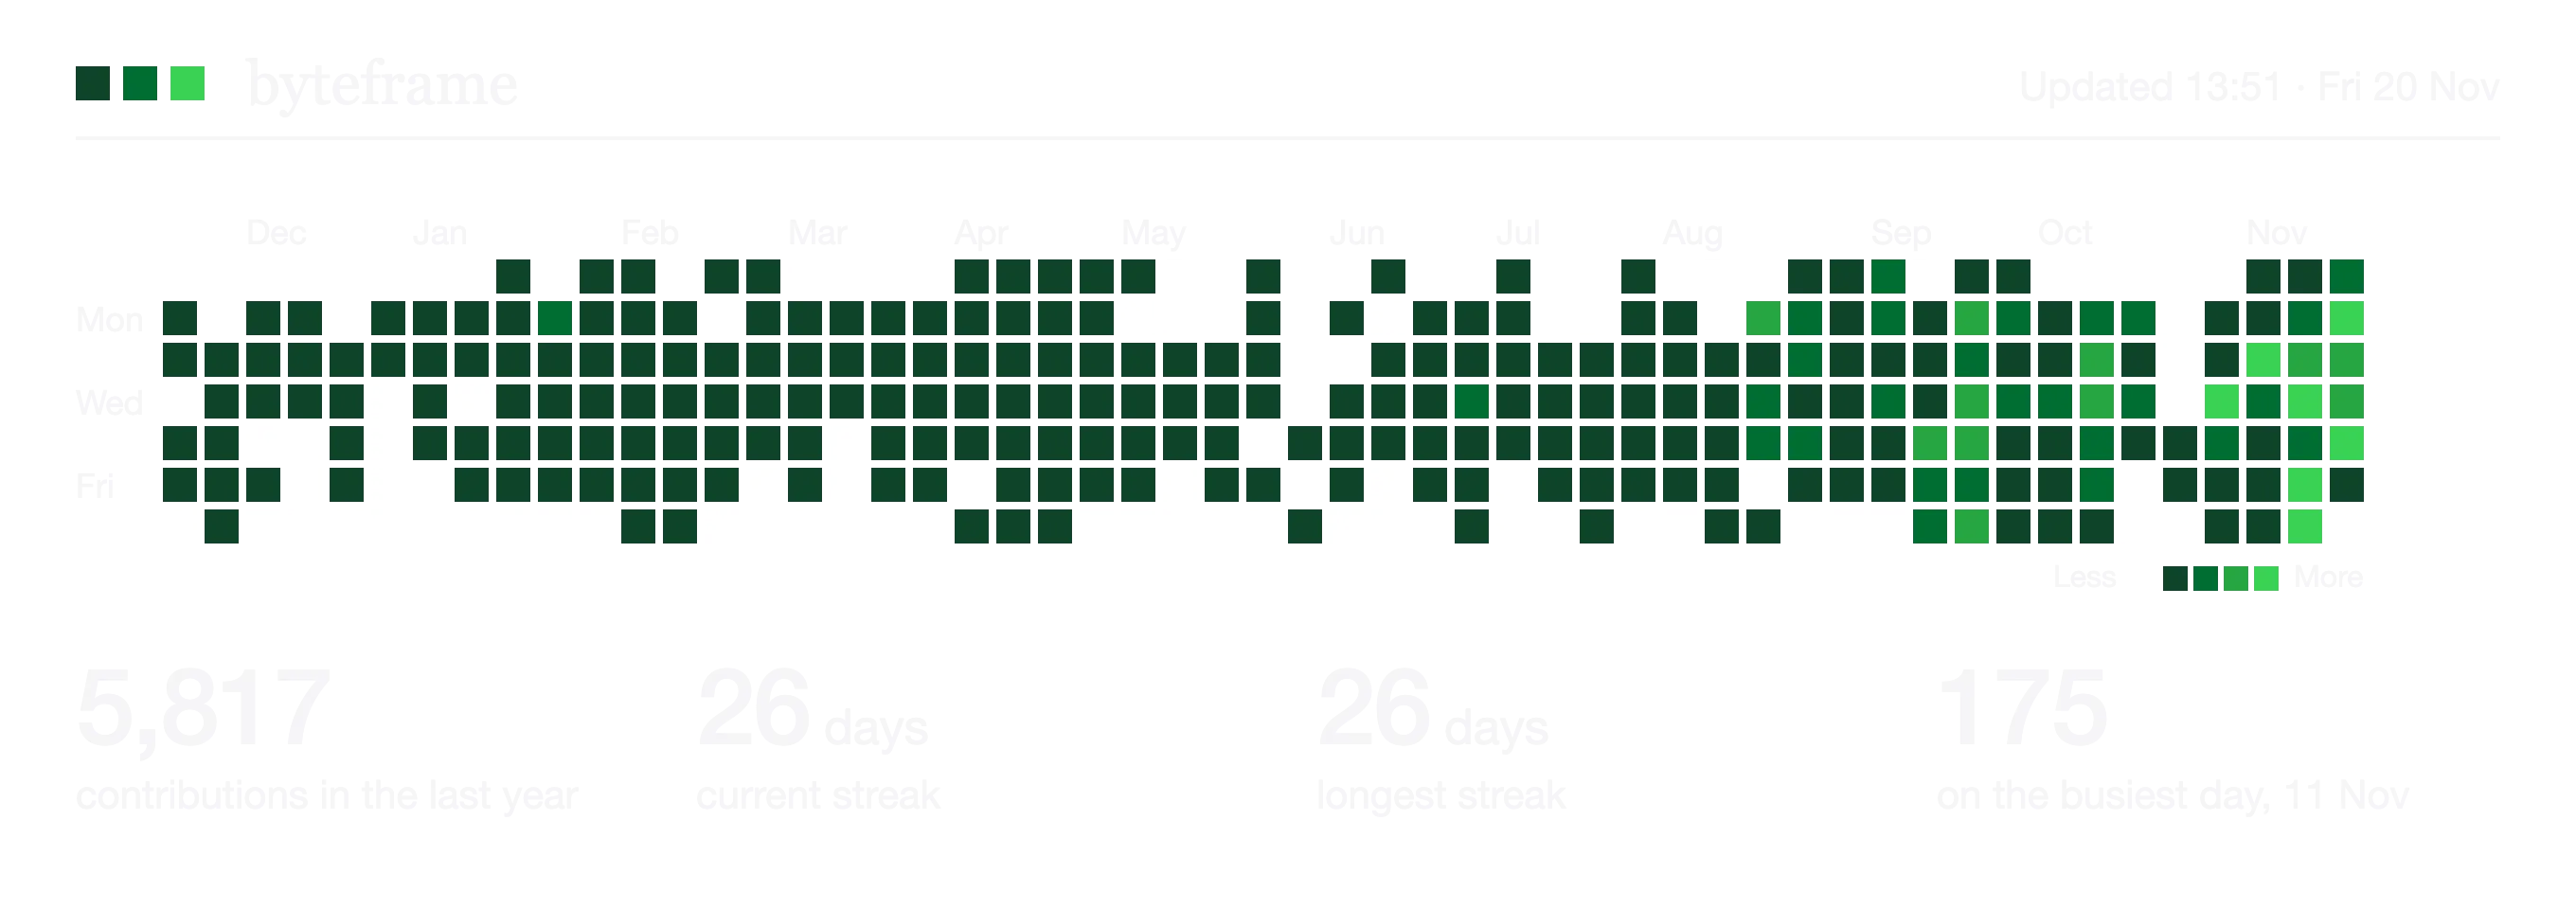
What counts as a contribution
GitHub’s contribution graph counts, for each day:
- Commits to a repository’s default branch (or
gh-pages), made with an email address linked to your account; - Pull requests and issues you open;
- Pull request reviews you submit;
- and a few others, such as creating a repository or starting a discussion.
The darker the square, the more you did that day, relative to your own busiest days.
Why some of your work doesn’t show
- Commits on other branches only count once they’re merged into the default branch.
- The commit email isn’t on your account. Check
git config user.emailagainst the emails in your GitHub settings. - Commits in a fork don’t count until they’re in the parent repository.
- Private work shows only if you’ve turned on private contributions in your profile settings. Even then, it appears as anonymous counts.
GitHub’s own help page, “Why are my contributions not showing up on my profile?”, covers the rest.
Streaks and the numbers worth watching
A long streak is satisfying, but the more useful signals are calmer ones:
- Your last 30 days: contributions, merged pull requests and releases.
- Your busiest day: what a big day looks like for you.
- Recent activity: what actually shipped this week.
None of them are a measure of your worth as a developer. They’re a nudge, and a quiet record of what you’ve built.
Keeping it in view
A browser tab works, but you have to go and look. Byteframe’s free Mac app puts your graph on a Liquid Glass card on your desktop, refreshed every 30 minutes, and you choose what it shows:
- The year’s calendar, with your current and longest streak underneath;
- Your total beside the calendar, next to your AI plans;
- The last 30 days and recent activity: merges, pushes and releases.
You can mix these with other widgets on the same page, pick Mono or Colour, and let Byteframe flip through your pages on a timer.
How Byteframe gets your data
Byteframe uses the GitHub CLI’s login on your Mac. Run gh auth login once, and Byteframe asks GitHub’s API for your contribution calendar, pull requests, releases and recent activity. The data goes straight from GitHub to your Mac. Byteframe has no server and no account, and never sends your data anywhere.